tl;dr 3h of road, 794 songs in my iTunes library, at least 20 songs repeating twice, 3 repeating thrice. Is it normal?
I am bored while driving, sometimes I listen to podcasts, sometimes I stay with music. For a long time I have had this strange feeling that when I touch “Shuffle” a subset of my songs are taken, and then the shuffle happens over those. You are like “oh I really want to listen to Pas n’importe quel toon” and it simply never comes … while you have already heard a lot of songs multiple times, like really a lot, … more than once.
You can find a lot of content on the Internet about how iTunes is not random… Like this question on Stack Exchange: Why isn’t iTunes shuffle random?. I am not sure whether those posts dating from the beginning of the decade are still accurate.
Reverse engineering iTunes would probably be the easiest way to be sure. But one of my frustration is to not have been better at statistics, I have been reading a bit Think Stats and I would like to see if I can try to put some statistical thinking to work.
Our facts
- 3 hours of road, 180 minutes
- Let’s take a conservative 2.5 minutes per song, that is 72 songs for the trip
- 794 songs
- At least 20 songs repeating twice, 3 repeating thrice
- Have I skipped songs? Yes, not just a bit. Let’s maybe triple those 72 songs, and consider we have drawn a sample of 216 songs that are making this trip’s playlist
Our big question
Can a random process generates what we have observed?
A serious case of birthday paradox
Reasoning by analogy is often very helpful, and a friend pointed me out that this is exactly the birthday paradox.
The birthday paradox is that you have 365 possible birthday dates, with some rough edges around the 29th February. And in a group of 23 people and consider whether two people may have the same birthday, an uneducated guess says that the probability should be fairly low, when in fact it is about 50%.
Here we do not have 365 days, we have 794 different songs and not 23 guests but 216 spots on the playlist. In terms of proportion 23 / 365 = 6.3% and 216 / 794 = 27.2%
To be honest I was also willing to be a bit analytical that just programming a simulation on that and finding out that the work was already done was both a disappointment and a relief.
A quick simulation
First the basic functions:
import random
import numpy as np


songs_in_library = 794 # identified by their number
playlist_size = 216


def get_random_playlist():
    return [
        random.randint(0, songs_in_library - 1)
        for _ in range(playlist_size)]


def get_frequency_histogram_data(playlist):
    '''
    Returns:
    dict: key are the number of repetitions, value are how many songs

    e.g. {0: 120, 1: 34, 2: 1} means that 120 songs were not in
    the playlist, 34 one time, 1 twice.
    '''
    count_per_song = get_count_per_song(playlist)
    histogram_data = {}
    for song in range(songs_in_library):
        count = count_per_song.get(song, 0)

        if count not in histogram_data:
            histogram_data[count] = 0

        histogram_data[count] += 1

    return histogram_data


def get_count_per_song(playlist):
    '''
    Returns:
    dict: key are the songs, value the number of occurence in playlist
    '''
    count_per_song = {}
    for song_number in playlist:
        if song_number not in count_per_song:
            count_per_song[song_number] = 0
        count_per_song[song_number] += 1
    return count_per_song
A bit of test would not hurt:
def test_basic_functions():
    test_playlist = get_random_playlist()
    assert(len(test_playlist ) == playlist_size)

    test_histogram = get_frequency_histogram_data(test_playlist)

    song_count_parts = [key * value for key, value in test_histogram.items()]
    song_count = np.sum(song_count_parts)
    assert(song_count == playlist_size)


test_basic_functions()
matching_at_least_20_double_occurences = 0
matching_at_least_3_triple_occurences = 0
matching_both = 0
number_to_generate = 10000
for _ in range(number_to_generate):
histogram_data = get_frequency_histogram_data(get_random_playlist())
matched = 0
if histogram_data.get(2, 0) >= 20:
matching_at_least_20_double_occurences += 1
matched += 1
if histogram_data.get(3, 0) >= 3:
matching_at_least_3_triple_occurences += 1
matched += 1
if matched < 2:
continue
matching_both += 1
frequency_for_20_double_occurences = float(matching_at_least_20_double_occurences) / number_to_generate
frequency_for_3_triple_occurences = float(matching_at_least_3_triple_occurences) / number_to_generate
frequency_for_both = float(matching_both) / number_to_generate
print("Matching 20 double occurences {0:9.5%}".format(frequency_for_20_double_occurences))
print("Matching 3 triple occurences {0:9.5%}".format(frequency_for_3_triple_occurences))
print("Matching both {0:9.5%}".format(frequency_for_both))Here goes the funny results:
Matching 20 double occurences  76.42000%
Matching 3 triple occurences   32.98000%
Matching both                  22.41000%
So well, nothing to blink about, even though it is not the first time I have the feeling of this sketchy randomness … it seems to actually pretty likely to occur. 20% is far from a rare event.
Seeing more
Let’s try to view the frequency of such distribution.
import matplotlib.pyplot as plt
import seaborn as sns
plt.style.use('seaborn-deep')

# remove the next line if you are not using a Jupyter notebook
%matplotlib inline

# distribution: one array entry per number of repetition
# array values are the number of songs repeated this amount of time
distribution = {}
for _ in range(number_to_generate):
    histogram_data = get_frequency_histogram_data(get_random_playlist())

    for repetition_count, song_count in histogram_data.items():
        if repetition_count not in distribution:
            distribution[repetition_count] = []

        distribution[repetition_count].append(song_count)


palette = list(sns.color_palette())

def plot_repetitions(render_repetitions):
    for repetitions in render_repetitions:
        config = {
            'bins': 20,
            'density': True,
            'histtype': 'bar',
            'label': 'Song with ' + str(repetitions) + ' repetitions',
            'color': palette.pop(0)
        }
        plt.hist(distribution[repetitions], **config)

    plt.legend(loc='upper right')

    plt.show()


plot_repetitions([0, 1, 2])

plot_repetitions([2, 3]) # Adding 4 affects scale too much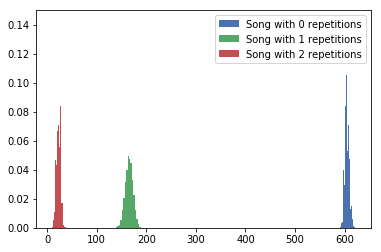
One repetition here only describes a single occurrence of the song in the selection.

Both graphs show “songs with two repetitions” proportion, we see here that having between 15 and 25 songs repeated twice is the norm.
We could also try to see how the selection size (the size of our playlist) impacts the number duplicates.
min_playlist_size = 72
max_playlist_size = 720
delta_playlist_size = max_playlist_size - min_playlist_size

playlist_size_to_library_ratio = []
unique_proportions = []

for step in range(101):
    progression = step / 100.

    # we modify the global variable at the beginning of the script
    playlist_size = min_playlist_size + int(progression * delta_playlist_size)

    for _ in range(10):
        playlist_size_to_library_ratio.append(float(playlist_size) / songs_in_library)

        histogram_data = get_frequency_histogram_data(get_random_playlist())
        unique_proportion = histogram_data.get(1, 0) / playlist_size
        unique_proportions.append(unique_proportion)


plt.plot(playlist_size_to_library_ratio, unique_proportions, '.');
plt.show()
Which gives us a projection of the relative size of the playlist to the song library size (x axis) and the proportion of unique song in the playlist (y axis). Checking our initial assumption of 216 songs over a library of 794 songs, the proportion of 27% leads to a proportion of unique songs of around 80%, about 44 positions of the playlist are likely to be repetitions of at most 22 unique songs.
Conclusion
My initial doubt about iTunes not being random were not really deserved. Sheer randomness has a high probability 22% to have generated the data I observed. The threshold usually used admitted in that kind of test is usually at 5%, we are way above it meaning that the initial belief of randomness is plausible.
Food for thought here, this experimentation is not relevant to conclude that iTunes is random, it only states that if iTunes were random, it could have generated those data, which is not exactly the same thing.