tl;dr is about the design of smart watches energy consumption reduction system using machine learning, this work got integrated in an early stage start up smart watch prototype.
Smart watches most consuming components are the screen and the CPU / GPU, smart watches are devices you use for an average of 4 seconds, those components should be switched off most of the time and only become active when they are needed for the active user.
General idea
For other purposes the smartwatches was already embedding an accelerometer, since the project was at the prototyping phase, integrating a gyroscope was an option.
The final code would have either run on the CPU with a low energy consumption frequency or on a microcontroller.
Protocol
- Sampling at a 20 Hz frequency the sensors on a various range of sequences: normal activity followed by a look on the watch
- Extracting time series for both states: “looking” / “not looking”
- Testing some feature engineering and machine learning models
- Integrating the algorithm in the watch.
Move sequences
We defined 27 sequences of activities (motions) followed by a look, like:
- Walking
- Being at a desk
- Chilling in a couch
- But to include edge cases in our learning base, also things like dancing
I still have those beautiful pictures that I feel compelled to share.
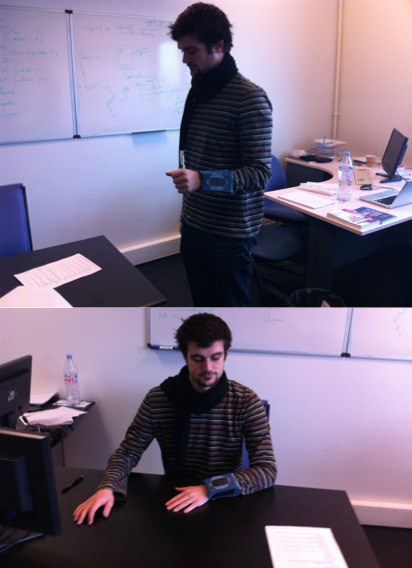
Note the N900 as a watch, we will soon launch a Kickstarter if you want one ;)
Defining the class
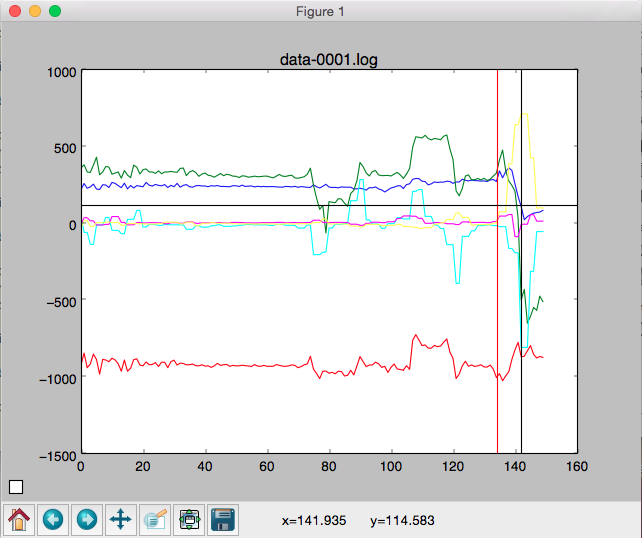
Then we have nice charts plotting the different sensors over time, one of the big missing things was to assign a class to those time series.
Knowing that we stopped recording our samples right after the look. We just had to search manually for the pattern changes and define a likely timeframe for the “looking” state.
Sampling
We generated the actual learning base by picking random points between the “looking” and “not looking” samples.
For each point, we extracted the last 40 last sensors values as features
to get our raw data lines. The two sensors (gyroscope and accelerometer) gives 3
values for three axis, X, Y and Z, so those raw data items were composed of
40 * 3 * 2 = 240 features and one class.
Reusing financial work
Then some feature engineering was required to enable the learning to be successful.
We aggregated data to create alternate dimensions time series, for example
GYROXY averaging GYROX and GYROY. We aggregated axis by pair, XY, YZ
and ZX but also all of them into some XYZ dimension.
We computed the discrete differential of first and second order for each time serie as well as their Standard Deviation, but we also computed financial indicators on those time series as if they were stock prices, for example computed the RSI of each time serie, this topic is detailed in my article about automated trading.
Still in this same article, we detailed how our preprocessing was generating differences of comparable dimension indicators. As well we generated features like: ‘STDDEV40-ACCZX_-_STDDEV20-ACCZX’, encoding the difference of different scales standard deviations.
In the final data items, we didn’t keep the 40 samples for each time series but only the last one, reducing the number of features to 380.
For similar models, the recall difference between feeding only the sensors values and the engineered data was:
- For Logistic Regression: from 60% to 85%
- For Neural Network: from 81% to 89%
Unfortunately I haven’t been able to find the data for Decision Trees.
Performance: from 20 seconds to 20 milliseconds
The target was to run at a frequency of 20 Hz, so the scoring had 50 ms to return, as a security we aimed at 40ms.
At a 20 seconds speed, it meant that if lucky the scoring would start when you would be looking at the watch and see the screen showing up after 20 seconds. If not lucky, you would not have been synchronized with the scoring rythm so you would not even see the screen switching on at some point. Something that was far from the tagret user experience.
N900 prototype 1
The first prototype was composed of:
- A Nokia N900, this thing was a jewel for prototyping, a bit of sewing and you have sensors on your wrist with a real Linux running on it.
- A C++ QT program, that was use for sampling and altered to let the user run a scoring of the last captured data.
- A Python preprocessing too,l that was generating an arff file
- A Weka exported Java scorer
- A few lines of bash to glue pieces together
The accuracy of this prototype is discussed later, it was good enough, but what wasn’t was the processing time was a bit too long: 20 seconds.
N900 prototype 2
We quickly understood that the problem of our prototype was called Java, a simple HelloWorld was taking at best 6 seconds to run on the N900, that’s the time it took to the JVM to load.
Since our model was a decision tree (discussed later), a quick rewrite in Python allowed us to drop below 13 seconds. Better, but not good enough.
Embedded version
At some point we switch away from the N900, to test on something closer to the prototype architecture (see the article header picture) and, in the end, the prototype itself.
We iterate a few times around having our code running on a microcontroller, the major optimizations elements were the following:
- The final decision tree we composed only of a few nodes, so only a few feature were required, in the end we only computed about 30 different features, including intermediate features. This drastically dropped down the computational intensity of the preprocessing
- Rewriting everything in C
- Considering embedding low level elements: using circular arrays
- Similarly, optimizing operations as much as we could. On the target device, a float division costed probably 30 times the time an integer addition. We stored intermediate results and used int as much as we could, multiplying by a factor to keep precision (and taking care of integer overflow.
All this enabled a comfortable 20ms execution time.
Being used to web and mobile software development and data processing using Python, I remember a seemingly outdated discussion with the electronic engineer overseeing the whole prototype design: “To ensure reliability we do not allow embedded programs to allocate memory at runtime. This means no malloc()s”.

The thing is when your code is shipped somewhere where it is critical and can not be updated, you take legitimate safety precautions.
The low level programming of the microcontroller legitimated the use of a decision tree for its simplicity of implementation. Porting more evolved model like regressions or artificial neural network in C would have been extremely time consuming and killing performances.
Theoretical accuracy and practical accuracy
Just note here that while precision had to remain reasonable, our focus was more about tuning recall since we had a strong preference for false positive compared to false negative.
Impact of the gyroscope
Quickly during our tests we dropped the usage of the gyroscope. Its energy consumption increase was not worth the information gain. This information gain was only giving a light contribution to the theoretical model and none in practical test.
When theory faces reality: scoring opportunities
Our theoretical model exposed a recall of 88%, though when a was giving a look at his watch only one positive scoring was enabling the screen to light for a few seconds, so we had a few scoring opportunities to ouput a positive.
The first tests gives us an accuracy of more than 90%.
We did not notice any high false positive rate doing strange moves.
When theory faces reality: user online learning
The thing we observed is also that users learn pretty quickly: after a few usage the accuracy almost reaches 100%, users were learning quickly without being asked to how to “trigger the switch”.
Conclusion
I did not have access anymore to a prototype after the first smart watches came out, but from what I remember what we built is still state of the art, I think also that we had a better accuracy than what is in most watches.
Side note: This work has been done in 2011 at KenaGard for one of our customers by my partner Alexandre Agular, an intern, that definitely helped us for the sampling, and me. The project outputs got patented and it was presented during at a Data Science Luxembourg event in 2015.